
Opinion Scales
What is an Opinion Scale?
Section titled “What is an Opinion Scale?”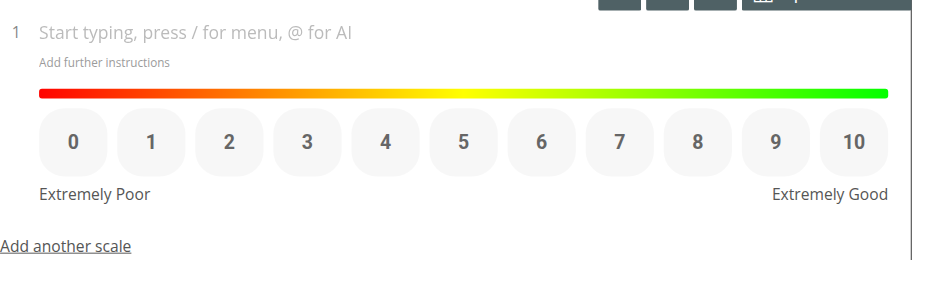
These question types provide your project respondents with a numbered scale, by which the statement or question it concerns can be rated. You can also customize the names of the extremes at either end of the scale, and choose whether the scale should be accompanied by a Rating Heat Bar (color bar).
You may also see Opinion Scales referred to as Likert scales, these simply refer to reliable ways of measuring attitudes or behaviors against a linear scale.
This is the same underlying question widget as the Slider question type — a Selection type setting lets you flip between “Scale” (this article) and “Slider” without recreating the question; the only real difference is how respondents interact with it.
Why use an Opinion Scale?
Section titled “Why use an Opinion Scale?”Opinions Scales provide respondents with a fresh and logical way of evaluating a question or statement, within the context of a scale you set. It’s also useful for when you’ve already used a Slider in your project, but wish to use another scaled question type. This way your format does not become stale.
How do I create an Opinion Scale?
Section titled “How do I create an Opinion Scale?”- Open the Build tab, and make sure you’re on the Questions tab in the sidebar
- Click + Question
- Select Opinion Scale from the Standard Questions category
- Enter your question text
Default Settings
Section titled “Default Settings”The default settings for this question type scale the answer options from 0-10 and are accompanied by a Rating Heat Bar, but this can be changed in the question’s settings panel. From there, you can also change your Scale into a Slider via Selection type. The scale extremes are set as ‘Extremely Poor’ (lesser extreme) and ‘Extremely Good’ (greater extreme) by default, but these can easily be edited by clicking on them.
Every Opinion Scale question also has an Add another scale link underneath it — clicking this adds a second (or third, etc.) scale to the same question, at which point it behaves like a Multi-Factor Scale.
- The scale options should be consistent and logical
- The scale options should be inclusive: if you’re rating an experience, the scale options should span from ‘very good’ to ‘very bad’, not ‘very good’ to ‘average’
- The question/ statement should only need a simple response
- Include as many scale points as you think necessary, but too many will affect the readability of your survey
- It’s not mandatory to name either end of the scale, but it may improve the clarity of the question/ statement
Question Settings
Section titled “Question Settings”Click Show more settings under the question to see the full set of options:
- Numbered: This button toggles the numbering for the concerned question.
- Rating Heat Bar: This allows you to toggle the visibility of the Rating Heat Bar. This is for visual purposes only, and cannot be interacted with by respondents.
- Selection type: Switches the question between Scale and Slider format.
- Range start / Range end: Set the start and end numbers for your scale.
- Required: By checking this box, respondents cannot finish the survey without completing the question.
There’s no separate “Personal info” toggle for this question type — if you need answers tied to a respondent’s contact record, use one of the dedicated Contact Details question types instead.
How respondents interact with the Opinion Scale
Section titled “How respondents interact with the Opinion Scale”The scale looks almost identical, to the respondent, as it looks whilst you are creating your project. The only difference lies in their ability to select a number in correspondence to your question or statement.
However, if you wish to preview your finished questions and format before finalizing the launch, click the Preview icon in the top toolbar.
The participants’ choice is not final until they click the Finish Survey button.
How to Analyze the Quick Report?
Section titled “How to Analyze the Quick Report?”Answer options will be displayed in their original order, from left to right, in the Data Table of your Quick Report. You will also receive stats on the standard deviation, total number of responses, and a weighted average for that question.
By default, your results will appear as a Column Graph, with each answer being assigned a colour within the chart. The other available options for this question type are Line Graph, Doughnut Chart, Radar Chart, Pie Chart.
Note: this reporting section was not re-verified in this pass.
For more detailed instructions on analyzing your report, you can visit either of these articles: