Available Charts and Graphs
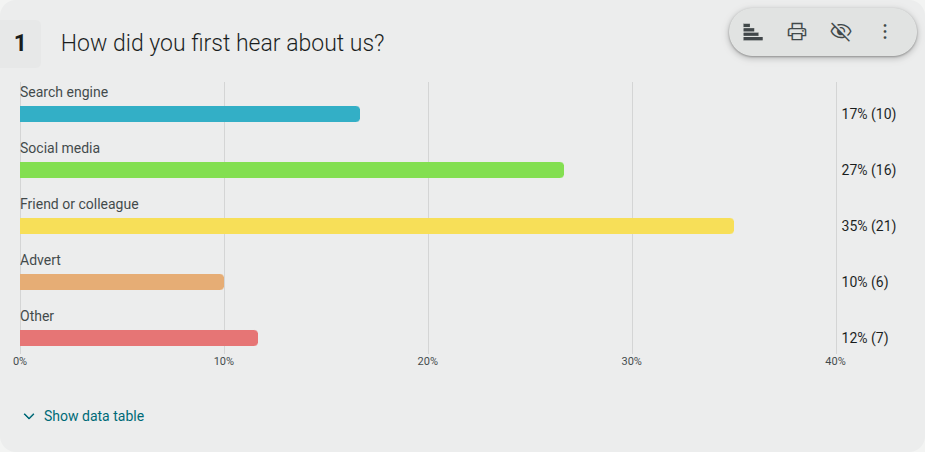
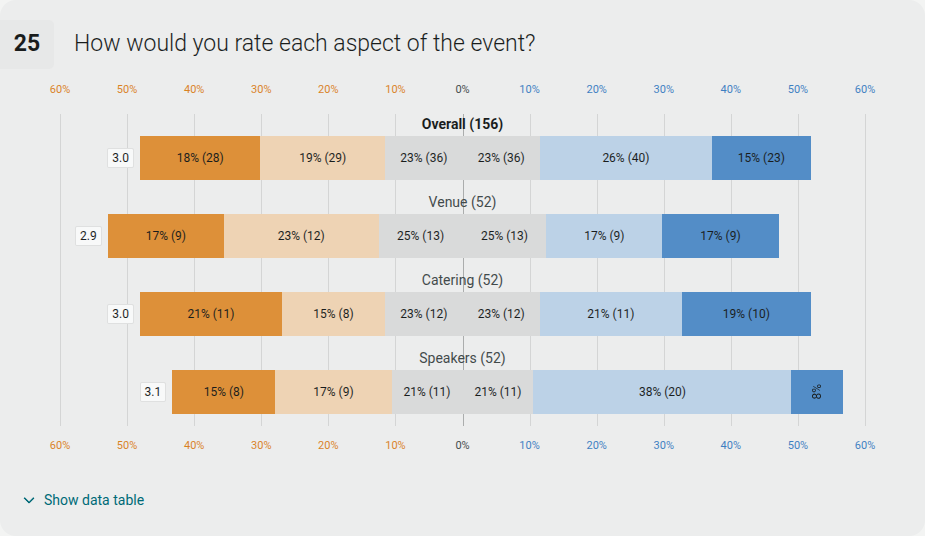
In the reports section, you’ll find the Quick Report for your project (Results > Report tab). In this area will be a Data Table and corresponding charts or graphs that visualise responses to your project.
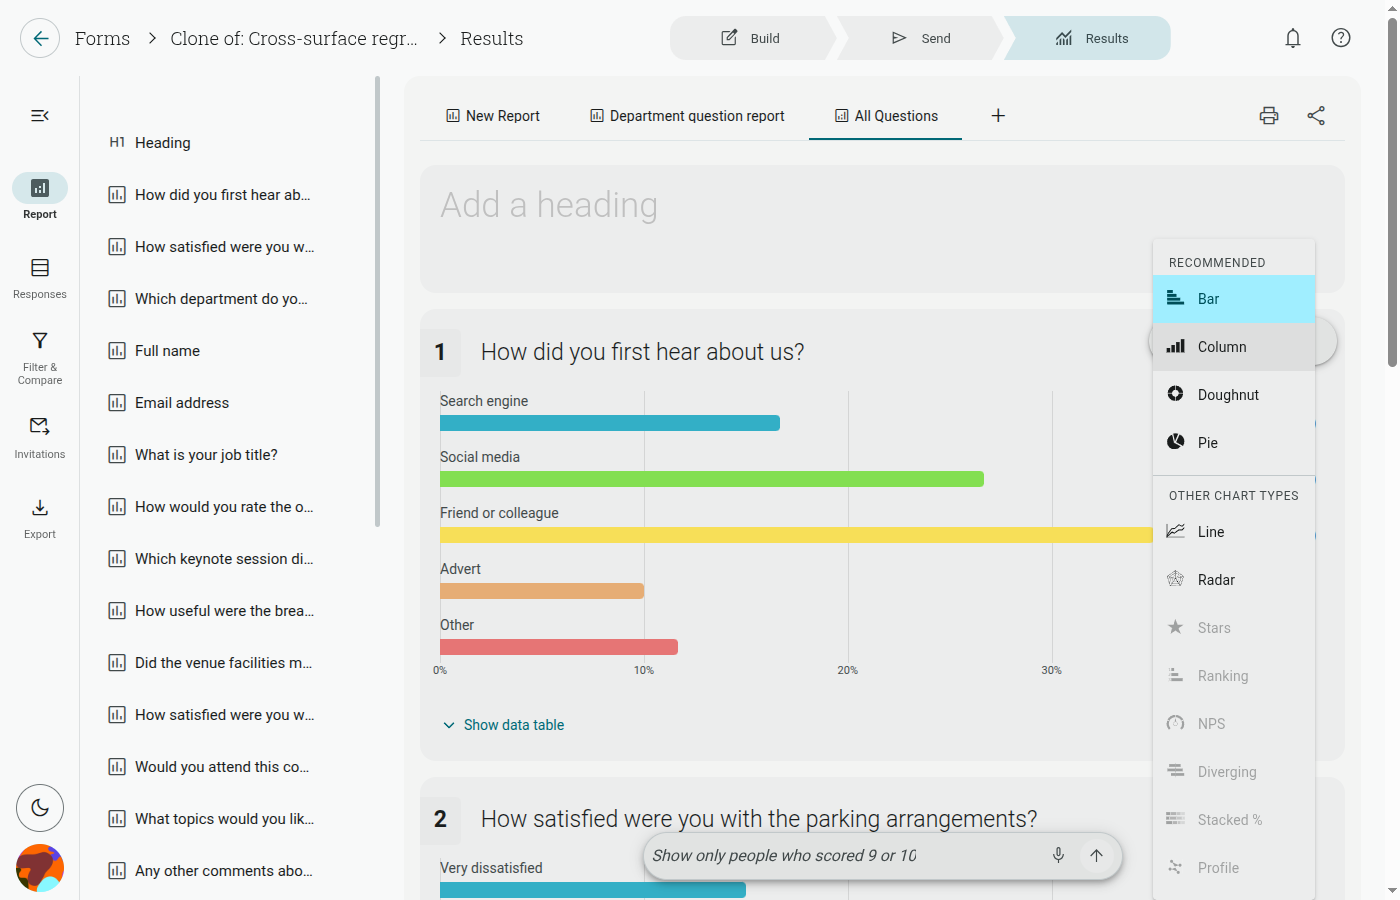
There is a selection of Chart/ Graph types that you can switch between, through the menu on each question in your Report. The Y-axis (vertical line) depicts the number of responses, whilst the X-axis (horizontal line) corresponds with the number selected by respondents.
List of Charts and Graphs
Section titled “List of Charts and Graphs”- Doughnut Chart
- Line Graph
- Column Graph
- Radar Chart
- Pie Chart
- Star Rating
- Rankings
- NPS (for the Net Promoter Score question type only)
Note: Not all graphs and charts are available to every question type, but you are able to switch between those that are available.
Changing Chart/ Graph Type
Section titled “Changing Chart/ Graph Type”- Go to the Results section of a form
- Click the small handle/⋮ icon to the left of the question you want to change
- Select ‘Change chart type’
- Choose another chart from the flyout menu
Note: You will be made aware of the Chart/ Graph types you cannot switch to, as they will be greyed out.
Tip: This updates your view immediately, but it’s only a preview. Click Save Changes To This Report (it appears next to the Report/Individual responses/Tracked responses tabs once you’ve made a change) to keep it — otherwise it resets the next time you load the page.
Available Chart/ Graph Types
Section titled “Available Chart/ Graph Types”You’ll find a list of question types, and the chart/ graph types available to them, in the list below. The default graph type will also be included.
Opinion Scales
Section titled “Opinion Scales”- Doughnut Chart
- Line Graph
- Column Graph
- Radar Chart
- Pie Chart
Default: Column Chart
Multi-Choice (Single Select)
Section titled “Multi-Choice (Single Select)”- Doughnut Chart
- Line Graph
- Column Graph
- Radar Chart
- Pie Chart
Default: Doughnut Chart
Multi-Choice (Multi-Select)
Section titled “Multi-Choice (Multi-Select)”- Doughnut Chart
- Line Graph
- Column Graph
- Radar Chart
- Pie Chart
Default: Column Graph
Star Rating
Section titled “Star Rating”- Line Graphs
- Column Graphs
- Radar Chart
- Stars
Default: Stars
Drop Down List
Section titled “Drop Down List”- Doughnut Chart
- Line Graph
- Column Graph
- Radar Chart
- Pie Chart
Default: Doughnut Chart
Order Ranking
Section titled “Order Ranking”- Line Graphs
- Column Graphs
- Radar Chart
- Ranking
Default: Ranking
Slider
Section titled “Slider”- Doughnut Chart
- Line Graph
- Column Graph
- Radar Chart
- Pie Chart
Default: Column Graph
Net Promoter Score (NPS)
Section titled “Net Promoter Score (NPS)”- Doughnut Chart
- Line Graph
- Column Graph
- NPS
Default: NPS
Comments/ Essay Box
Section titled “Comments/ Essay Box”- Text Responses
Text Box (Single)
Section titled “Text Box (Single)”- Text Responses
Text Boxes (Multiple)
Section titled “Text Boxes (Multiple)”- Text Responses
Matrix (Common Scale)
Section titled “Matrix (Common Scale)”- Line Graphs
- Column Graphs
- Radar Chart
- Stars
Default: Radar Chart
Multi-Factor Scale
Section titled “Multi-Factor Scale”- Doughnut Chart
- Line Graph
- Column Graph
- Radar Chart
- Pie Chart
Default: Column Graph
Multi-Factor Slider
Section titled “Multi-Factor Slider”- Doughnut Chart
- Line Graph
- Column Graph
- Radar Chart
- Pie Chart
Default: Column Graph
Picture Choice (Single Select)
Section titled “Picture Choice (Single Select)”- Doughnut Chart
- Line Graph
- Column Graph
- Radar Chart
- Pie Chart
Default: Doughnut Chart
Picture Choice (Multi-Select)
Section titled “Picture Choice (Multi-Select)”- Doughnut Chart
- Line Graph
- Column Graph
- Radar Chart
- Pie Chart
Default: Column Graph
Picture Comments
Section titled “Picture Comments”- Text Responses
Contact Form/ Zip Code Lookup/ Email Address/ Web Address
Section titled “Contact Form/ Zip Code Lookup/ Email Address/ Web Address”- Text Responses