
Adding Elements to Reports
Once you’ve collected all the necessary responses for your project, you may want to customize its results to improve the aesthetics.
Note: This feature is not available for free accounts.
To access the list of page items, follow the below instructions:
- Open a project
- Go to the Results section
- Select Add Item at the foot of the report, at the end of the outline, or from an item’s menu
- Choose a page item to insert
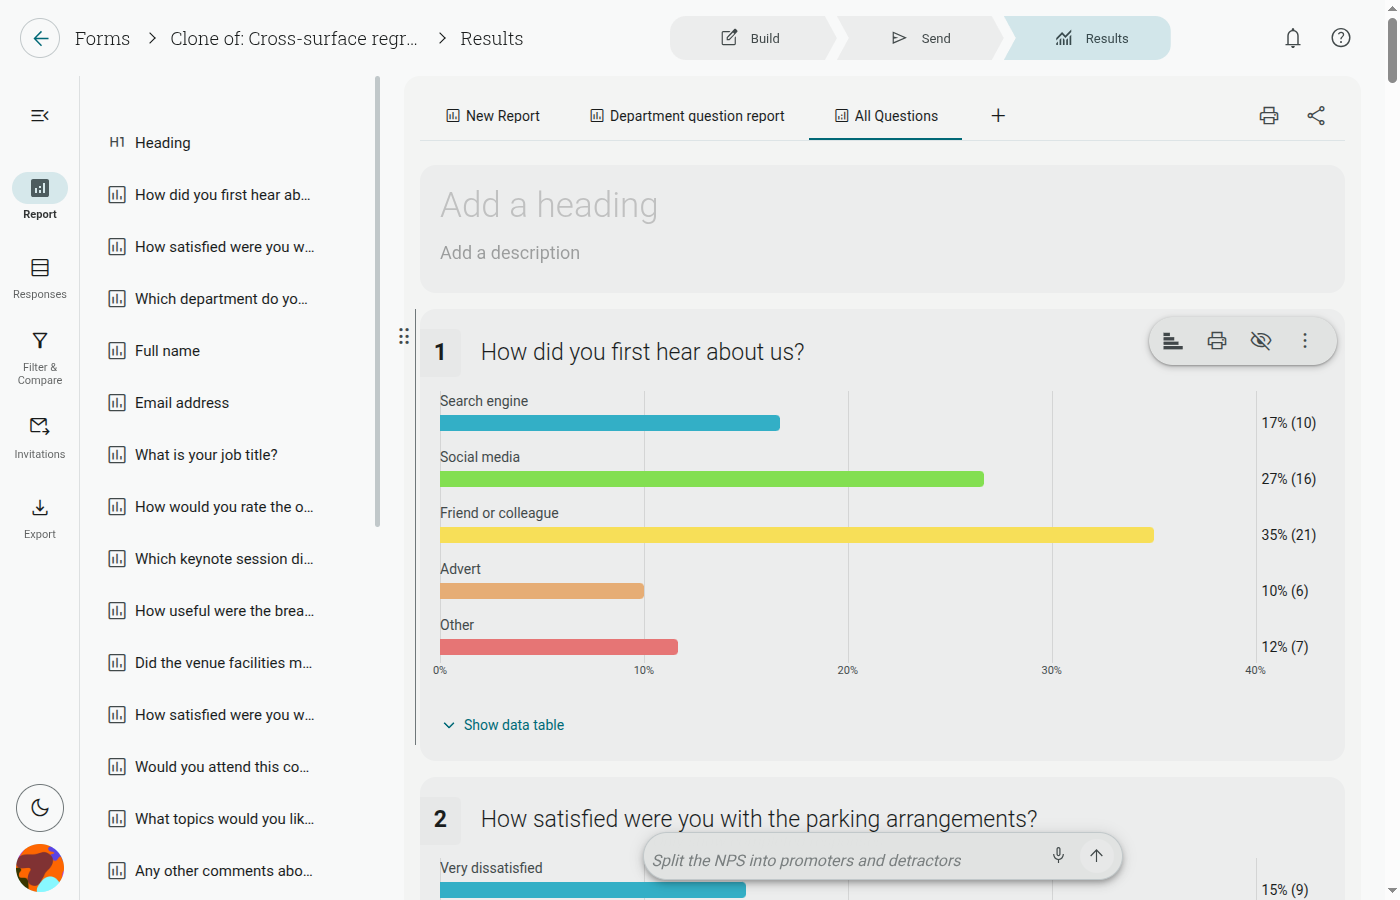
Note: Editing the automatically-generated Default Report directly will prompt you to “Save Changes” — this creates a new report rather than modifying the default one. If you want to keep customizing a report over time, create a new report first.
What Page Items are Available?
Section titled “What Page Items are Available?”These are the page items that can be inserted into any report:
- Question Data
- Heading
- Text
- Image
- Filter Information
- Campaign Statistics
Question Data
Section titled “Question Data”This can be used to display a Chart and Data Table/ Text Responses for a question from the project you’re in. Once placed, this element will open a dropdown asking you to choose the question to insert results from.
A menu will be then opened from which you can edit the chart type, display options, and labels concerning that question.
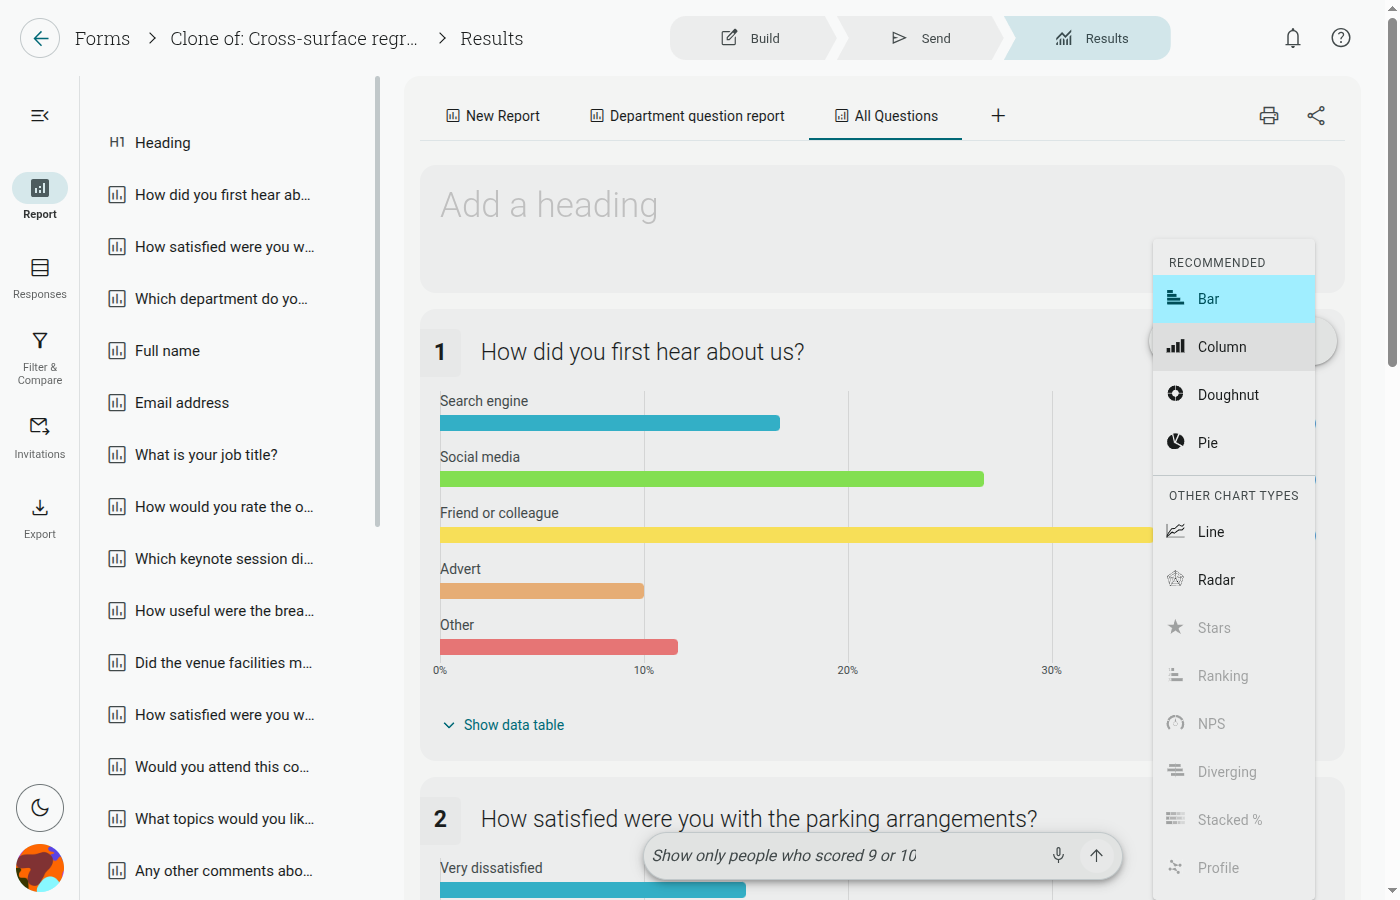
Tip: You can choose to exclude the chart or data table from a result through the ‘General’ section of the pop-up menu.
Heading
Section titled “Heading”Use this item to insert headings or titles into your report, in order to split the results into groups of related questions. It’s inserted directly into your report as an editable title and body placeholder — just click into it and type.
Insert a text box into your report, which you will be able to fill with text. These are useful for providing further context or information concerning questions and results in your report.
This element opens an image picker rather than a plain URL field: choose ‘Choose Image’ to search stock photos, or switch to the ‘Upload / My Gallery’ tab to upload your own image or reuse one already in your account. You can also add an optional caption before clicking ‘Add’.
Filter Information
Section titled “Filter Information”This page item will declare the filters and comparisons applied to your report. One is added automatically when a filter or comparison is applied to a report, but can be deleted or reinserted. Each rule is listed in plain English, with AND/OR badges between them, and comparisons appearing below filters.
Note: You must have a filter(s) applied to insert this item — otherwise you’ll see an alert: “You must have filters applied to add the ‘Filter Info’ element.”
Campaign Statistics
Section titled “Campaign Statistics”This item shows performance stats for email campaigns sent for this form (opens, clicks, etc). You can select one or more campaigns to display, or leave it unconfigured to automatically show the most recent campaign. Only campaigns in a Scheduled, Sending, or Complete state will show data.
Deleting Page Items
Section titled “Deleting Page Items”- Open the item’s menu
- Select Delete
- Confirm your selection
Note: Once you have deleted a page item, it (and all its data) will be removed permanently.