
Group or Hide Answer Results
Group or hide answer choices in the chart for a close-ended question type.
Group Answer Options
Section titled “Group Answer Options”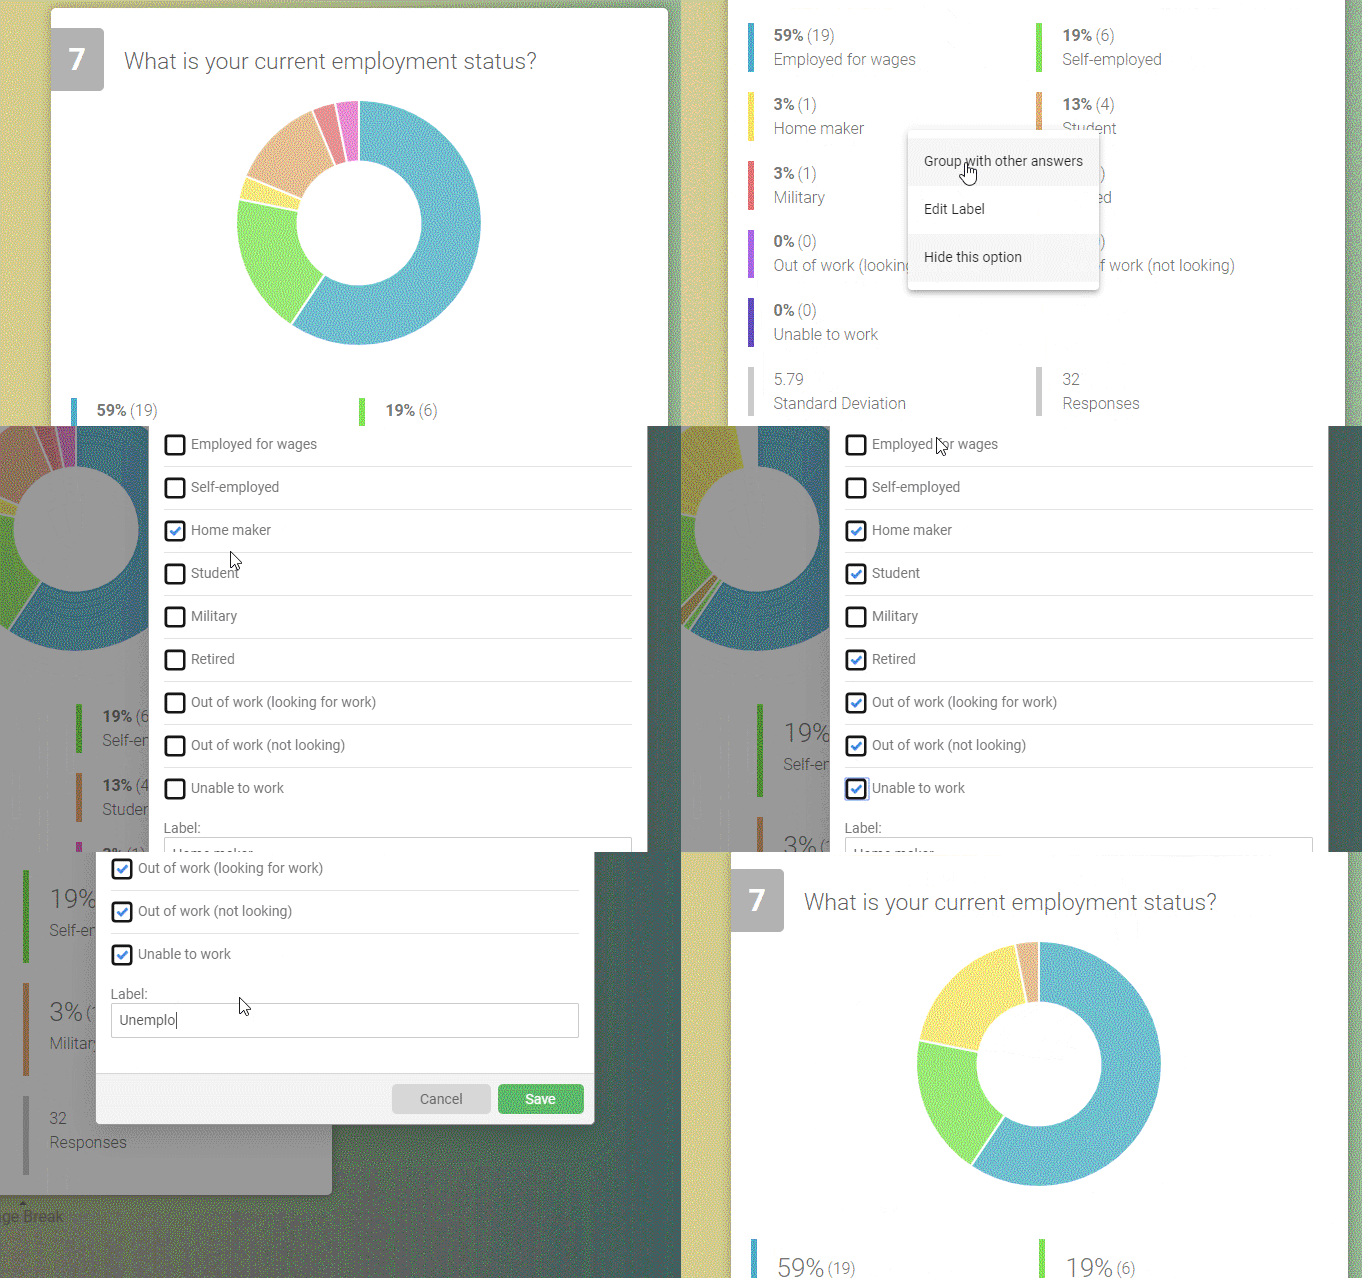
- Go to Summary report for your survey, form, or quiz.
- Find the chart you want to group answer results for.
- Click one of the answer choices (either the segment in the chart, or its percentage/label beneath it) you want to be in the group.
- Select Group with other answers from the menu that appears (this menu also offers Edit Label and Hide this option).
- In the Answer data grouping dialog, select at least two answer options in total to combine into the group.
- Edit the Label field to describe the new grouped answer.
- Click Save.
Your chart results will then be recalculated to represent all grouped answer choices as one result. To disable the group and count all answers separately again, click the grouped answer option and select Ungroup these answers.
Hide Answer Options
Section titled “Hide Answer Options”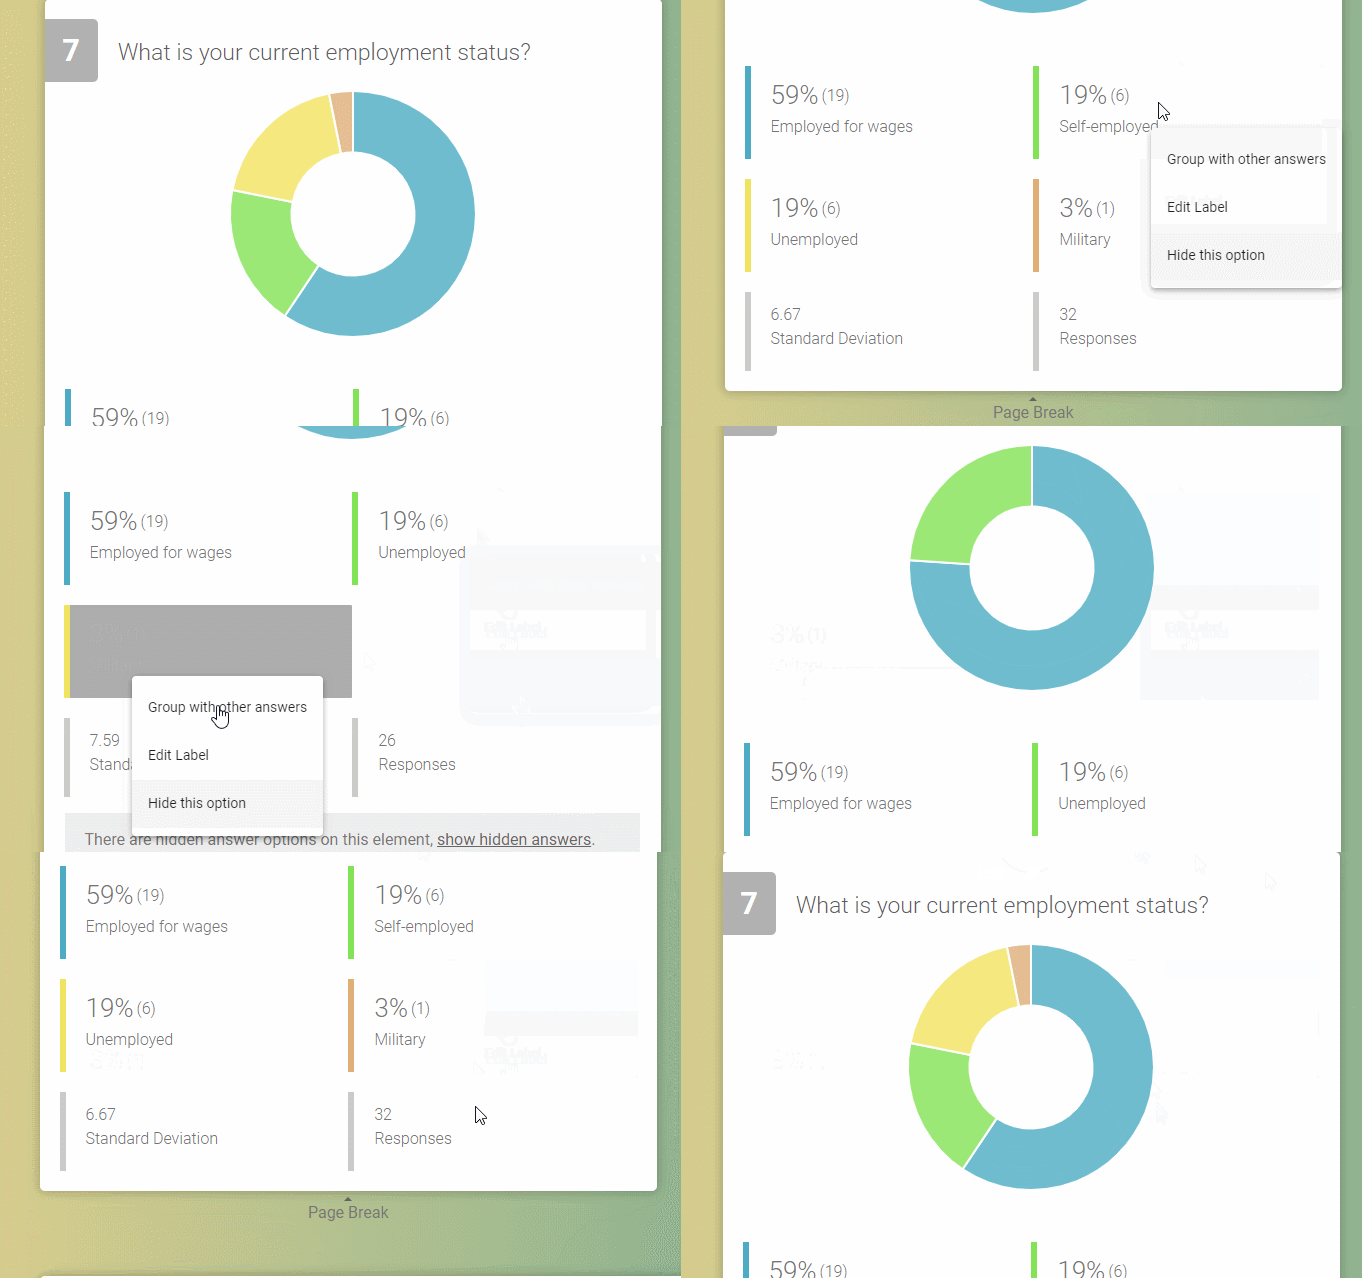
- Go to Summary report.
- Find the chart you want to hide answer results from.
- Click the answer choice you wish to hide.
- Select Hide this option.
Your results will then be recalculated to ignore all the data for that answer option, and a note appears under the chart: “There are hidden answer options on this element, show hidden answers.” Click show hidden answers to bring the option back into the chart.
Note: Grouping or hiding answer choices changes your charts’ display but does not affect the raw data of your results.