How to Filter and Compare Results (Segmenting and Cross-Analysis)
Our Filtering and Comparison features allow you to create different views of your data, making it easy to identify patterns and trends.
You can apply rules based on survey questions, survey engagement, email campaigns, and email metrics.
For example, we don’t collect any demographic information automatically (as our surveys are anonymous by default). So, if you need to filter and compare data by Age or Gender, you’ll need to create questions that ask for this information.
| Filter Type | Description | Example |
|---|---|---|
| Contact fields | Filter or compare survey data and email metrics based on default fields or custom fields you create for contacts. | Default fields: Name, Email, Company, City, State, Country. Custom fields: Birthdays, Customer Type, Plan/ Subscription. |
| Contact Group | Filter and compare data according to contact groups. Available rules: - In Group - Not In Group - In all Groups selected - Not in any Groups selected | Compare survey responses and email metrics between Annual Customers (Group 1) and Monthly Customers (Group 2). |
| Contact Unsubscribed | Filter or compare data based on whether contacts are still subscribed to your list. Available rules: - Is Subscribed - Is not Subscribed | Example 1: Filter out the responses of unsubscribed contacts. Example 2: Compare subscriber survey responses to those from unsubscribed to contact to identify key differences in feedback. |
| Contact Source | Filter and compare data based on the source your contacts were imported to your list from: - Added manually - Imported - API - Webform | Compare open and click rates between each of these groups. Identify if one source of list building collects more engaged contacts, e.g. Imported Contacts vs. Webform Signups. |
| Contact Sign Up Date | Filter and compare survey data and email metrics based on the data contacts subscribed to your list. Available rules include: - Date is Equal To - Date is Greater Than - Date is Less Than - Date is Greater Than or Equal To - Date is Less Than or Equal To | Compare survey responses from contacts who subscribed between March 1st - 31st and April 1st - 30th. This is especially useful if you have made changes to your service, sign-up forms, or survey questions that may impact changes. You can use this feature to track the changes in responses and identify what may have caused this. |
| Campaigns | Filter and compare data based on how contacts engaged with email campaigns. - Available rules include: - Campaign was sent - Campaign was not sent - Responded to Survey - Did Not Respond to Survey - Email was Opened - Email was Not Opened - Campaign Link was Clicked - Campaign Link was Not Clicked | Example 1: Filter out responses that were submitted outside of an email campaign, e.g. those who accessed the link somewhere else. Example 2: Identify contacts who opened your email but did not respond to your survey. |
| Contact Statistics | Filter and compare survey responses based on contact’s averaged email engagement metrics. Available rules: - Emails Opened - Emails Clicked - Open Rate - Click Rate - Emails Sent | View responses from your most engaged respondents. Example 1: Filter out contacts who have an email open rate of less than 50%. Example 2: Compare survey responses of your most and least engaged contacts. |
| Form Question Answers | Filter or compare based on answer selections for survey questions. This is the default option when you add a filter. | If you collect demographics in a survey, you can filter and compare responses by Age and Gender. Or filter by other questions, such as ratings and multiple-choice selections. If you’re trying to calculate your Net Promoter Score, you can view other survey comments and feedback based on the score customers have given. |
| Calculator formula results | Filter or compare based on a Calculator project’s formula output. Only shown for Calculator-type projects. | Compare respondents whose calculated quote came out above and below a certain threshold. |
| Form Completion | Choose to filter by or compare Complete and Incomplete responses. | Filter out Incomplete responses |
| Form Response Date | Filter or compare data based on response dates. | When running a customer effort score survey, you’d collect feedback with the aim of removing points of friction for your customers. You can use the same survey to track the success of these changes and compare responses before and after the date changes were made. |
| Form Response Country | Filter or compare based on respondent locations. | Compare responses between the UK and US. |
Filters
Section titled “Filters”Before you get started adding filters, we should define the difference between Rules and Rulesets.
Rules: These are the filters you apply to your results to create unique views based on the list above.
Rule Sets: These allow you to apply filters beneath your top-tier rule that interact in different ways.
Clicking + AND beneath a rule adds a separate rule to the filter. Respondents must match all rules joined this way to be included.
Clicking + OR within a rule adds another condition to that same rule (for example, a second answer to match). Respondents matching any of the conditions joined this way are included.

Creating filter rules
Section titled “Creating filter rules”To apply a filter to your results:
- Go to the Quick Report of your project
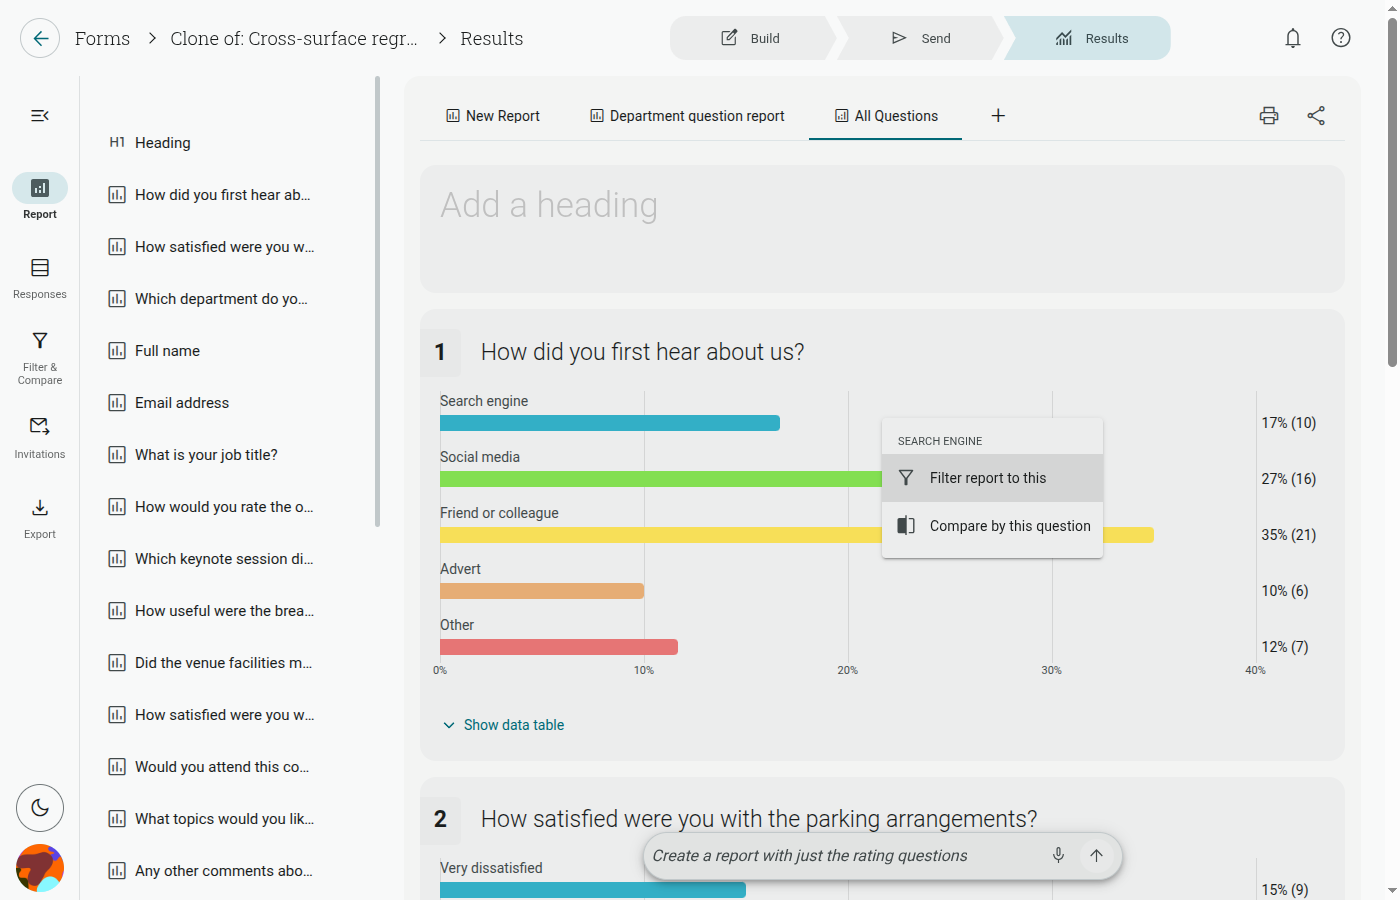
- Click Filter & Compare in the left-hand toolbar
- Click + Add Filter
- Choose a category from the Filter by dropdown (this defaults to Form Question Answers)
- Use the dropdown(s) that appear to pick the specific question/field and the value(s) to match Click + OR to match any of several values/conditions, or + AND to add a completely separate rule — this choice is only relevant if you intend to apply multiple rules to the same filter
- Click Save
A banner reading “Your filter is incomplete. You must ensure that options for each rule have been selected.” appears until every rule has a value chosen.
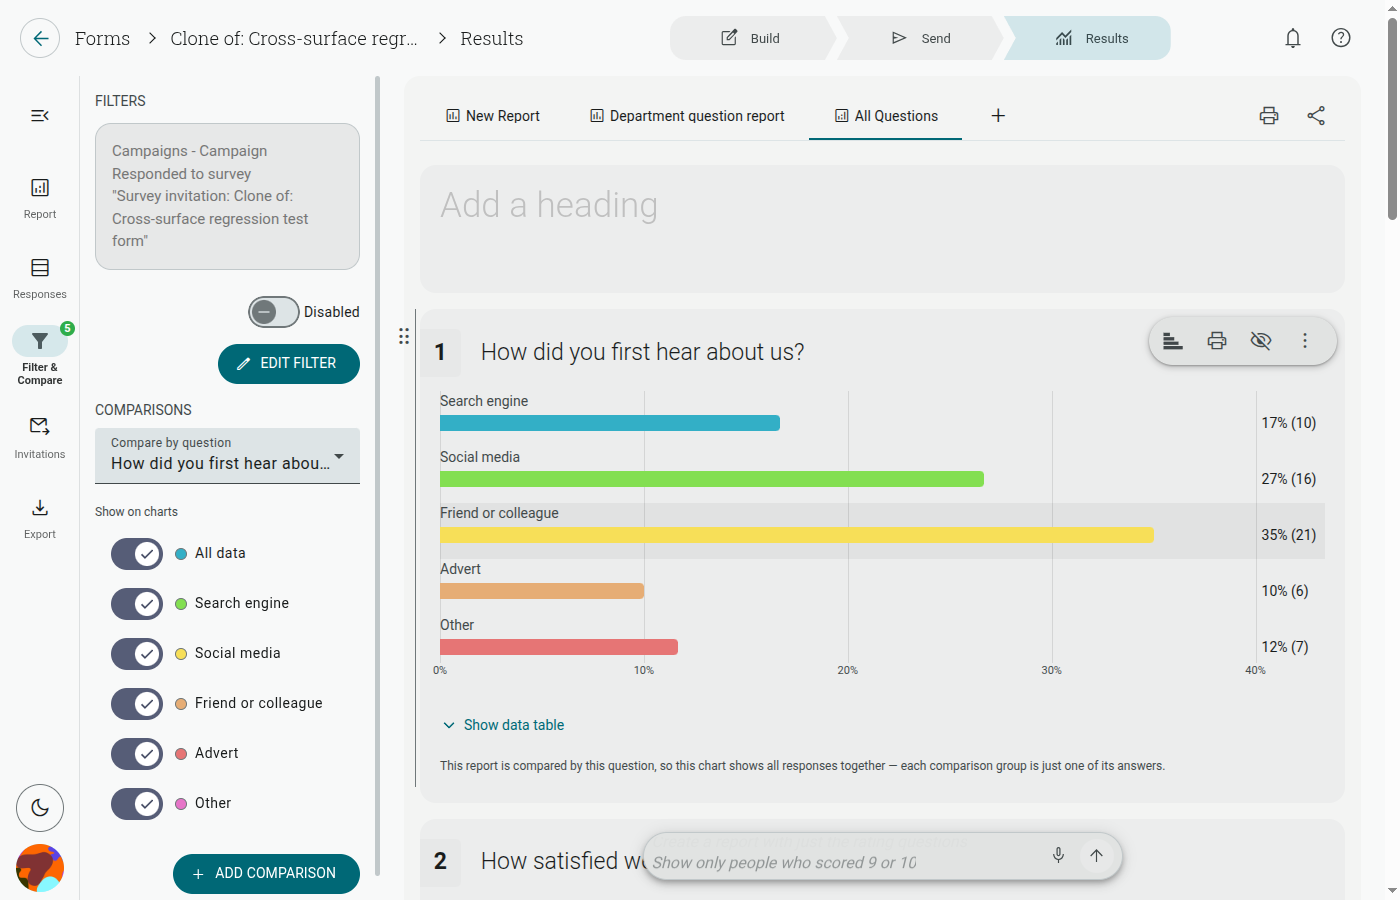
Once you have applied a filter, you will see it listed under Filters in the left-hand panel, along with an Enabled toggle and an Edit Filter button.
From here, you can flip the Enabled toggle to disable a filter without deleting it, or click Edit Filter to change or delete its rules.
Applying Multiple Filters
Section titled “Applying Multiple Filters”
It is possible to apply multiple filters to your project results. To do this:
- Click Filter & Compare in the left-hand toolbar
- Click Edit Filter on the filter you want to add to
- Click + AND to add another rule (or + OR to add another condition to an existing rule) This choice is only relevant if you intend to apply multiple rules to the same filter
- Choose the Filter by category and value(s) for the new rule
- Click Save
Please refer to the sections on And/Or above for information on how these interact with each other.
Comparisons
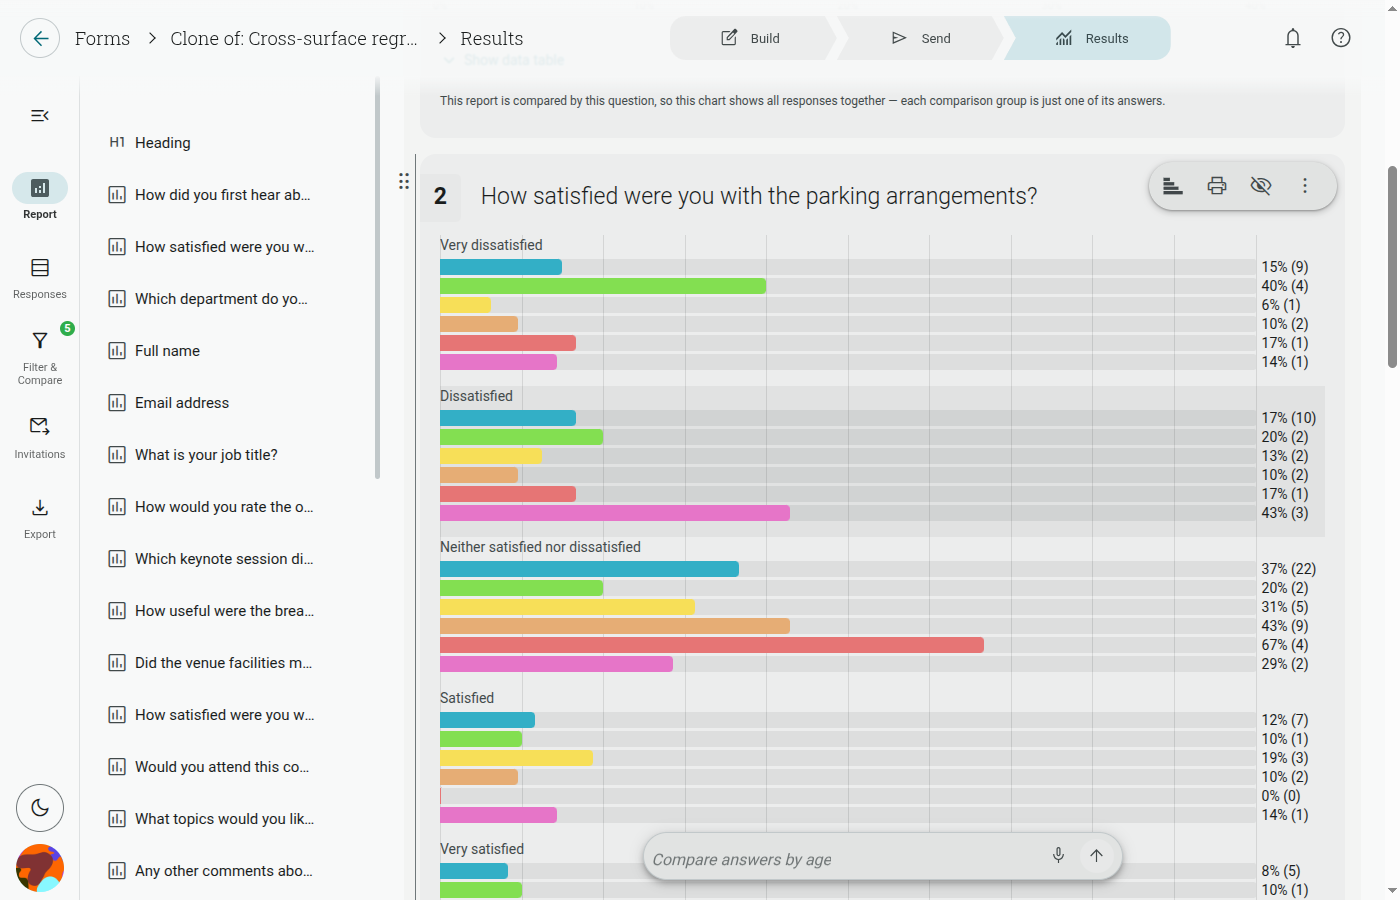
Section titled “Comparisons”This feature is also referred to as Cross-Analysis. It allows you to compare two filtered sets of data side-by-side throughout your report.
For example, if you asked your respondents for their age, you can compare answers from these age groups for each question you asked.
Creating Comparison Rules
Section titled “Creating Comparison Rules”To apply a Comparison to your results:
- Go to the Quick Report of your project
- Click Filter & Compare in the left-hand toolbar
- Click + Add Comparison
- Enter a name in the required Name your comparison field — this is what distinguishes the comparison’s columns in your report
- Choose a category from the Filter by dropdown and pick the specific question/field and value(s), as with a filter
- Click + OR/ + AND if you need more than one rule
- Click Save

Mixing Filters and Comparisons
Section titled “Mixing Filters and Comparisons”It can be difficult to control the entire respondent population that participates in your project. By mixing Filters and Comparisons, you can narrow the scope of your Report to a group, or groups, within the total population.
E.g. You may only be interested in the answer choices of 18-24 years old and 25-30 years old. Therefore, you can apply the necessary filters for the age groups, then set up a comparison between them for a side-by-side contrast.
To do this:
- Apply filters of your choice
- Apply a comparison that correlates with those filters
- How to Include Filter and Comparison Information in your Report
How to Delete Filters and Comparisons
Section titled “How to Delete Filters and Comparisons”To delete a filter or comparison from your project report:
- Go to your Quick Report
- Click Filter & Compare in the left-hand toolbar
- Find the Filter/Comparison you want to remove and click Edit Filter/Edit Comparison
- Click the trash icon on the right of the rule you want to delete
- Click Save
If you just want to switch a filter or comparison off temporarily rather than delete it, use its Enabled toggle instead.