About the Quick Report
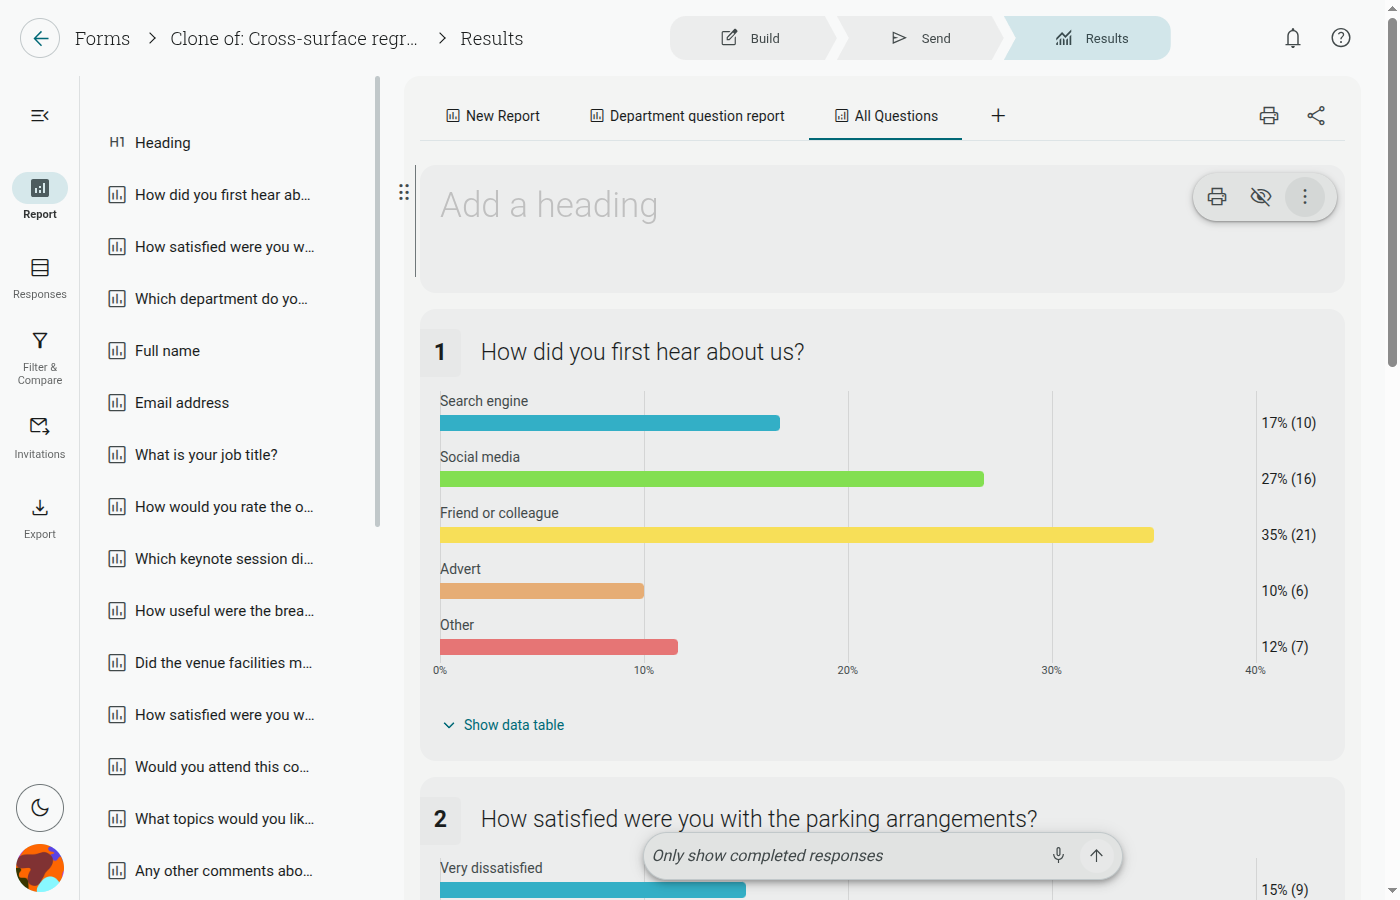
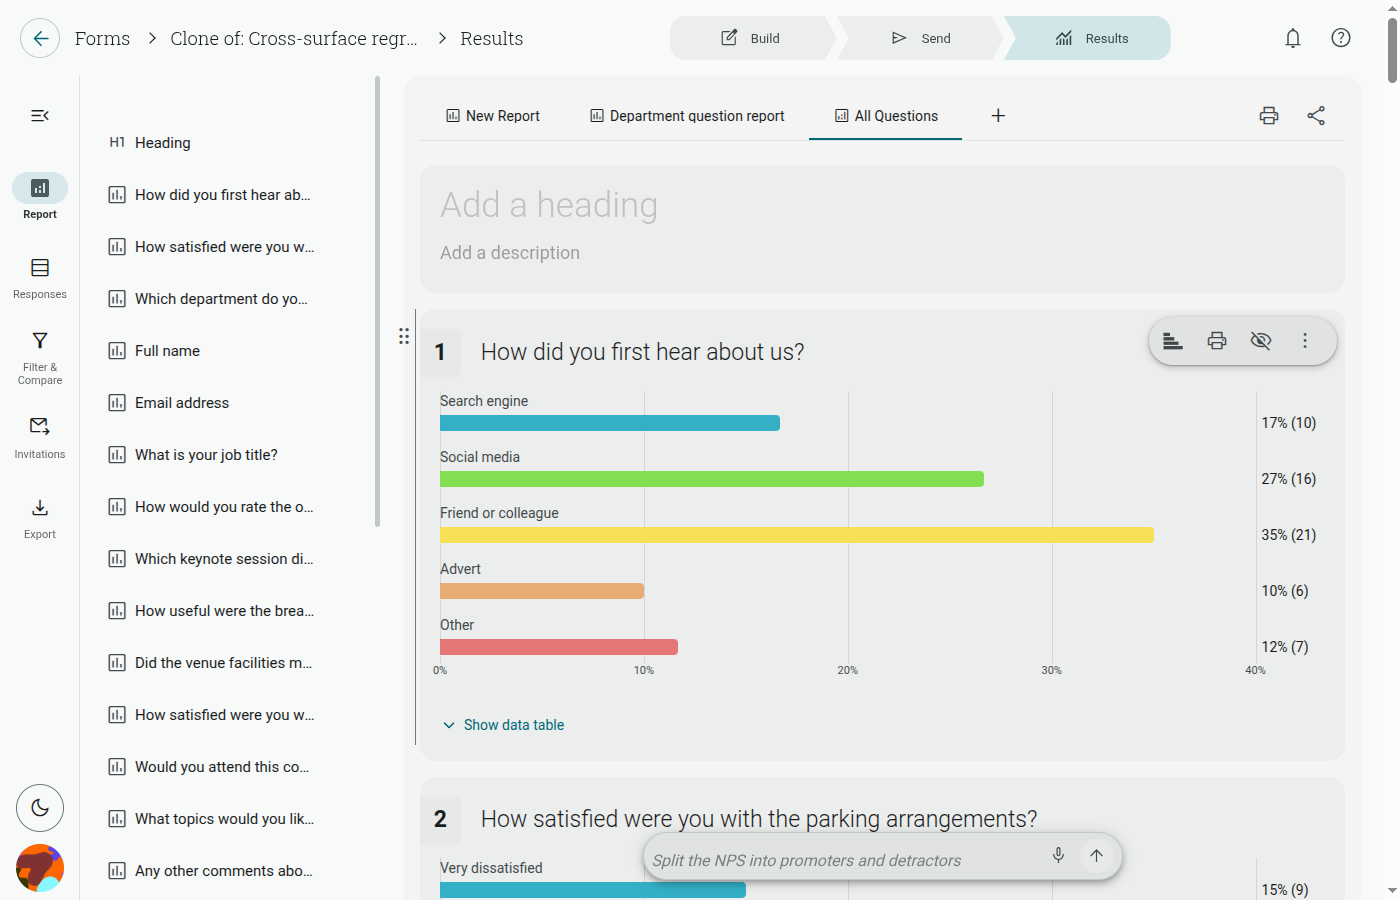
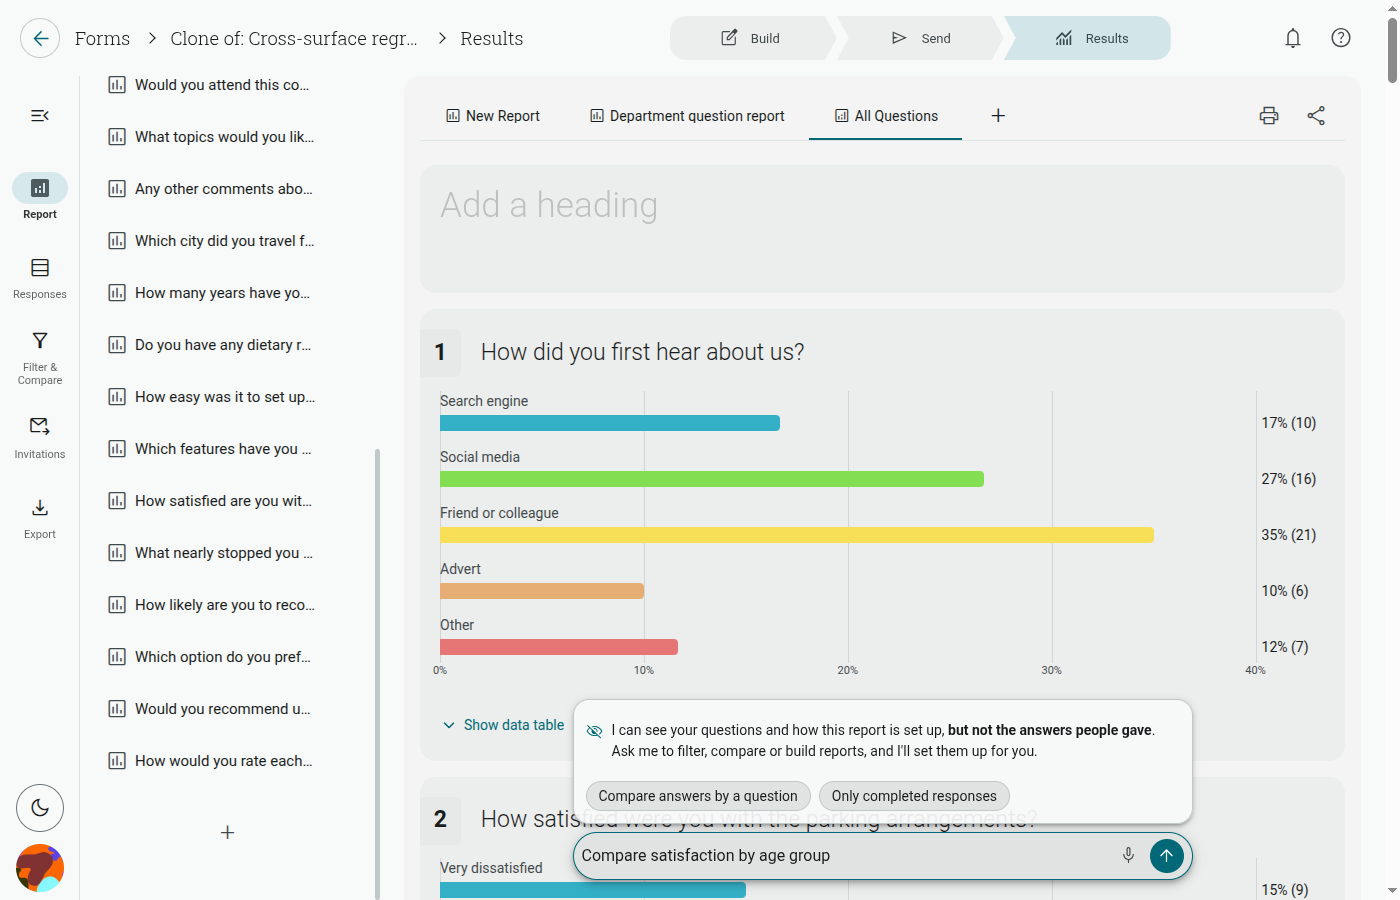
This is the section of your results that contains all responses, data tables, and charts. In the app today this lives under the Results tab of your form, in the Report sub-tab (the underlying report is still referred to internally as the “quick report”).
The Data Table
Section titled “The Data Table”This feature will present you with the averaged results from all respondents for each question. For questions with numeric-style answers (Opinion Scale, Star Rating, NPS, Sliders, Matrix, and similar), you’ll also see:

- Responses
- Weighted Average
Note: These statistics will not be provided for all question types, as some answers can’t be analyzed numerically. Multi-choice and dropdown questions instead show a simple percentage breakdown next to the chart, without a Weighted Average.
Responses
Section titled “Responses”This number represents the total number of responses you received for a question.
Weighted Average
Section titled “Weighted Average”This average is determined by the importance of individual figures within a data set. The higher percentage of times a number or answer is chosen by respondents, the more influential it becomes in calculating a weighted average.
Charts and Graphs
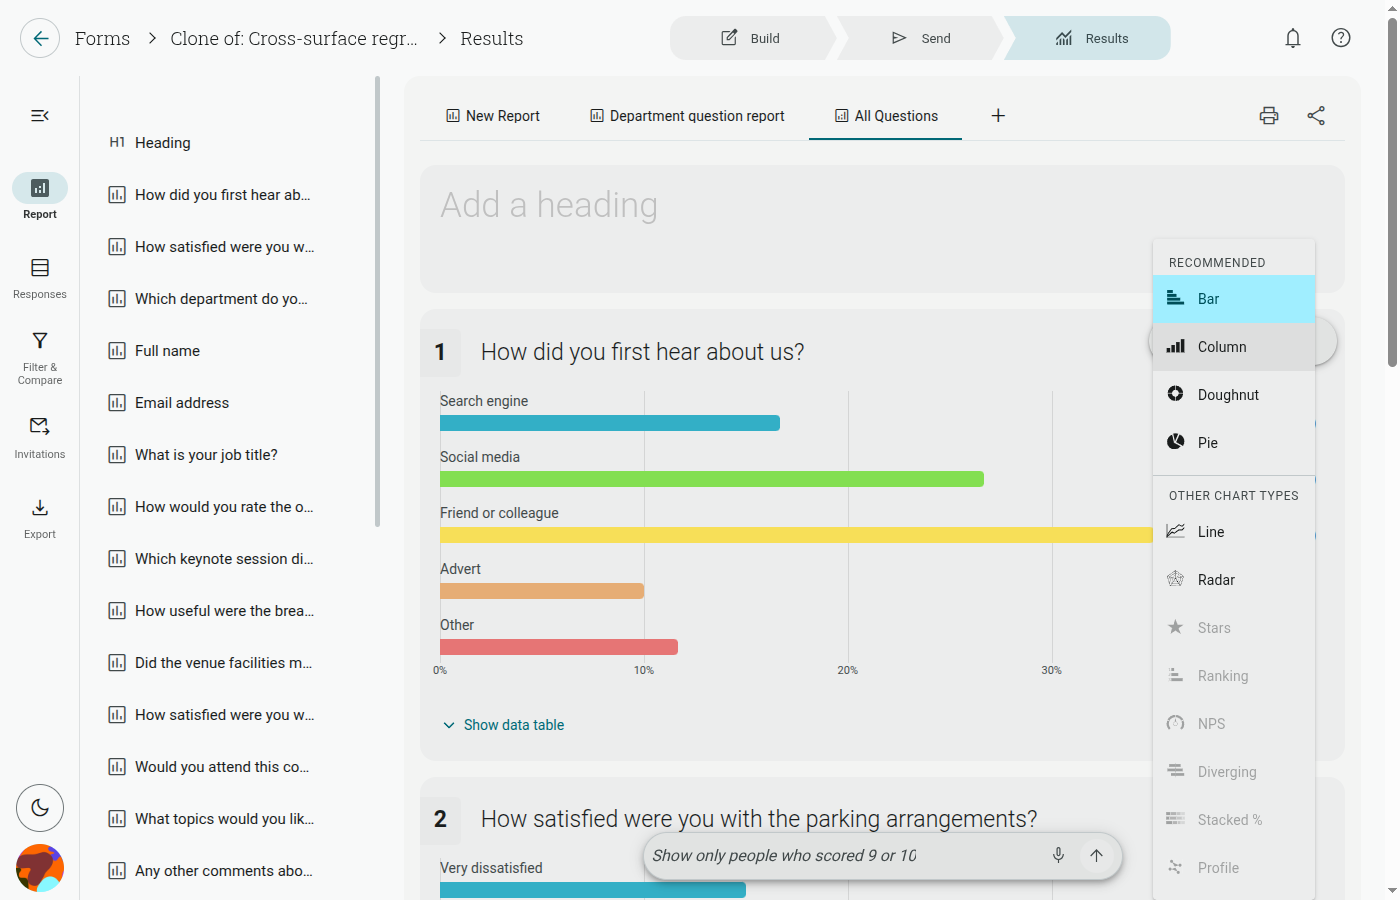
Section titled “Charts and Graphs”There is a selection of Chart/ Graph types that you can switch between, through the menu on each question in your Report (click the small handle/⋮ icon to the left of a question, then choose ‘Change chart type’). The Y-axis (vertical line) depicts the number of responses, whilst the X-axis (horizontal line) corresponds with the number selected by respondents.
The available chart types are:
- Doughnut Chart
- Line Graph
- Column Graph
- Radar Chart
- Pie Chart
- Star Rating
- Rankings
- NPS (for the Net Promoter Score question type only)
Note: Not all graphs and charts are available to every question type, but you are able to switch between those that are available — types you can’t switch to are greyed out. See Available Charts and Graphs for the full breakdown by question type.
Tip: Changing a chart type updates your view immediately, but it’s only a preview. Click Save Changes To This Report (it appears next to the Report/Individual responses/Tracked responses tabs once you’ve made a change) to keep it — otherwise it resets the next time you load the page.
Text Responses
Section titled “Text Responses”Some responses will be formatted as text, this will be true for any questions that required respondents to type out an answer. They will be listed below the question, in the order that participants submitted them.
Note: Question types that require respondents to input text cannot be attributed points, i.e. text responses will have no weight in calculating results.
Managing the Default Report
Section titled “Managing the Default Report”The Report tab under Results always shows your project’s built-in report. This default report doesn’t currently have an editable title from the Results screen. If you want a separate, differently-scoped view of your data, click the Reports icon in the left sidebar of the Results view and choose Add Report to create an additional report for the same project.
How to Customize Reports
Section titled “How to Customize Reports”Once you’ve collected all the necessary responses for your project, you may want to customize its results to improve the aesthetics. To access the list of page items, follow the below instructions:
- Open a form
- Go to the Results section
- Click ‘Add Item’ in the left sidebar
- Choose a page item to insert
Report Theme
Section titled “Report Theme”Older versions of the report builder had a dedicated background/colour theme picker directly in this sidebar. We couldn’t locate an equivalent panel in the current Results screen (checked the Reports, Add Item, Filter & Compare, Print, Export, and Share panels) — this may have moved or been retired. See Changing Report Themes for the current guidance on this.
What Page Items are Available?
Section titled “What Page Items are Available?”These are the six page items that can be inserted into your Quick Report:
- Question Data
- Heading
- Text
- Image
- Filter Information
- Campaign Statistics
Question Data
Section titled “Question Data”This can be used to display a Chart and Data Table/ Text Responses for a question from the project you’re in. Once placed, this element will ask you to choose a question to insert the results from.
A menu will be then opened from which you can edit the chart type, display options, and labels concerning that question.
Tip: In the ‘Chart Options’ section of this menu, you can independently toggle Show Chart and Show Data Table to hide either one from your report.
Heading
Section titled “Heading”Use this item to insert headings/ titles into your report, in order to split the results into groups of related questions. Once you have placed this item in your report, you will be asked to enter the heading text.
You will then be able to choose whether your heading is formatted as:
- Small
- Medium
- Large
Insert a text box into your report, which you will be able to fill with text. These are useful for providing further context or information concerning questions and results in your report.
This element will allow you to insert an image into your Quick Report using just an image URL. Simply insert the image link into the field labelled ‘Image URL’, and then click ‘Create’. You will see your chosen image where you placed the Image element.
Filter Information
Section titled “Filter Information”This page item will declare the filters and comparisons applied to your report. One is added automatically when a report is created but can be deleted/ re-inserted. Each will be listed beneath their corresponding icon, with comparisons appearing below filters.
Note: You must have a filter(s)/ comparisons applied to insert this item.
Campaign Statistics
Section titled “Campaign Statistics”This item shows engagement statistics from email campaigns linked to your project. You can select one or more campaigns to display; only campaigns in a Scheduled, Sending, or Complete state are available to pick. If you don’t choose one, it defaults to showing the most recent eligible campaign.
Deleting Page Items
Section titled “Deleting Page Items”- Click the small handle/⋮ icon on the page item you want to remove
- Click ‘Delete element’
- Confirm your selection if prompted
Note: Once you have deleted a page item, it (and all its data) will be removed permanently.