
Net Promoter Score Question Type
Calculating your Net Promoter Score will help you measure customer loyalty to your brand. You can do this by asking one simple question: ” How likely are you to recommend us to a friend or colleague?”
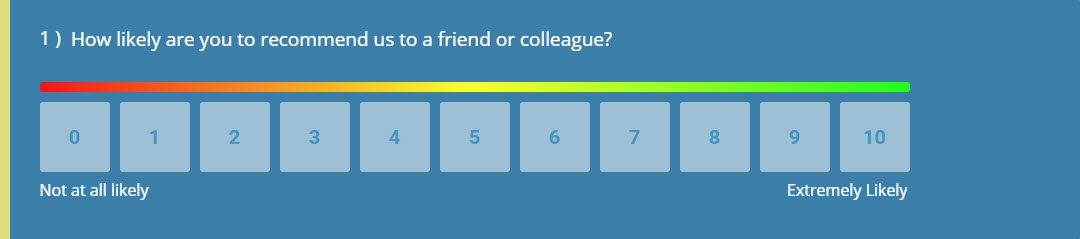
Customers will choose a rating from 0 to 10 (Not at all Likely - Extremely Likely) and will be grouped into three categories based on their rating.
- Those who select between 0 and 6 are Detractors (red).
- Those who select either 7 and 8 are Passives (orange).
- Those who select either 9 or 10 are Promoters (green).
How to add a Net Promoter Score question
Section titled “How to add a Net Promoter Score question”To add an NPS question to your survey, follow these steps:
- Open the Questions tab
- Click + Question
- Select Net Promoter Score® from the Special category (use the search box if it’s easier to find)
Analyzing Net Promoter Score
Section titled “Analyzing Net Promoter Score”Your NPS is automatically calculated by us. Your score and number of Detractors, Passives and Promoters is compiled into a graph for you. You will also be able to view the number of responses for each point in the scale, from 0 to 10.
How is NPS calculated?
Section titled “How is NPS calculated?”To calculate your Net Promoter Score, your percentage of Detractors is subtracted from your percentage of Promoters. The resulting number is your NPS score and will be between -100 and +100.
Question Settings
Section titled “Question Settings”Clicking an NPS question reveals its settings panel in the Questions tab. Required and Numbered are shown immediately; click Show more settings to reveal the rest:
- Numbered: This button toggles the numbering for the concerned question.
- Rating Heat Bar: This allows you to toggle the visibility of the Rating Heat Bar. This is for visual purposes only, and cannot be interacted with by respondents.
- Required: By checking this box, respondents cannot finish the survey without completing the question.
Filtering by NPS
Section titled “Filtering by NPS”You’ll be able to filter your report by responses from Promoters, Passives and Detractors. Allowing you to create separate reports for each customer group, meaning you can compile actionable feedback to improve the experience for each group.
- Go to the Results tab
- Click Filter & Compare in the sidebar
- Click ‘Add Filter’
- Filter by ‘Question’
- Select your NPS question
- Tick the boxes for each group
- Tick 0 to 6 to create a report for your Detractors.
- Tick 7 and 8 to create a report for your Passives
- Tick 9 and 10 to create a report for your Promoters
You will need to copy your report and follow these steps in each to create separate reports for each group.
Compare data sets by NPS
Section titled “Compare data sets by NPS”You can also compare the results from Promoters, Passives and Detractors in the same report.
Create a comparison group for Detractors
Section titled “Create a comparison group for Detractors”- Go to the Results tab
- Click Filter & Compare
- Click ‘Add Comparison’
- Select your NPS question
- Tick the boxes from 0 to 6
Create a comparison group for Passives
Section titled “Create a comparison group for Passives”- Go to the Results tab
- Click Filter & Compare
- Click ‘Add Comparison’
- Select your NPS question
- Tick the boxes for 7 and 8
Create a comparison group for Promoters
Section titled “Create a comparison group for Promoters”- Go to the Results tab
- Click Filter & Compare
- Click ‘Add Comparison’
- Select your NPS question
- Tick the boxes for 9 and 10
You will now see 4 charts/ graphs for each question in your report:
- All data
- Detractors
- Passives
- Promoters
Open the Filter & Compare panel and click the tick next to the ‘All data’ view to hide this in your results. Then you will only see the comparisons for each of your NPS customer groups.